It is assumed that you have understood the basics of CAT scripts.
Typically, when running an MD simulation, snapshots (called frames) are stored in regular time intervals - resulting in a molecular trajectory file. The aim of this tutorial is now to process a trajectory file - typically containing thousands of frames - and measure structural parameters such as atom-atom distances, angles and torsions as a function of simulation time.
For this you will be introduced now to an important concept used in CAT: data objects called wave. Wave is short for waveform which means evenly spaced data. If you would like to analyze a molecular parameter in CAT, in many cases this can be done simply by defining a wave of a certain value_type using the wave_def command. Please be aware that the wave labels need to be unique in a script since they are used as ID for the wave.
Let's have a look at the following script:
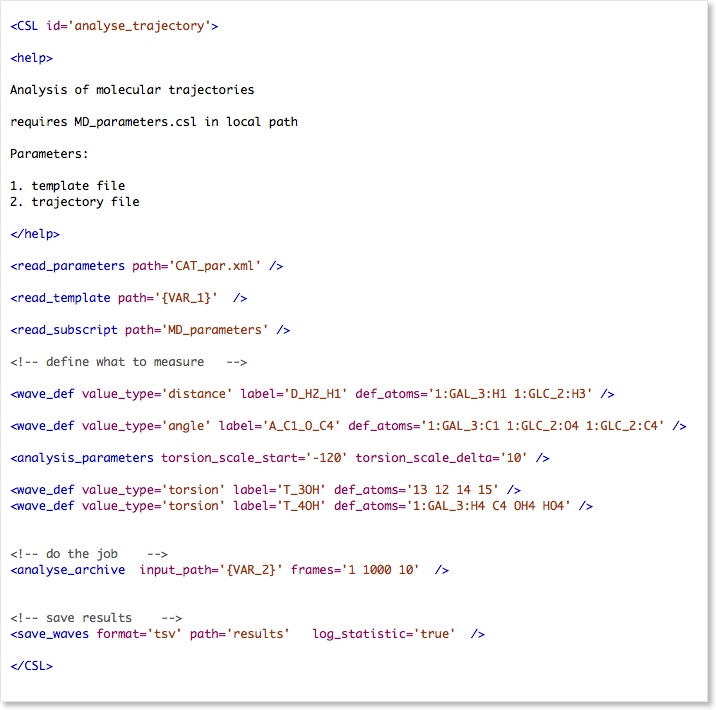
First the parameters are read from CAT_par.xml, then the molecular template using read_template.
The template is required to allocate the molecular structure in memory and assign all the atom names, residue types, molecules, etc.
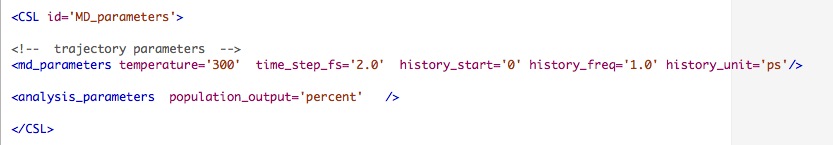
CSL allows parts of the script to be merged from external resources using the read_subscript command. This is useful if you would like to reuse a script from a central repository for different simulations and merge the parameters that are only valid for the current simulation from a CSL file that is stored in the local directory. Here the command is used to read parameters like simulation temperature etc.
The wave_def commands that follow read_subscript could be also stored in the external file, but for this tutorial we leave them in the main script.
There are three types of waves defined in this script: distance, angle and torsion waves. Next to the value_type and the label, these wave require a set of 2, 3 or 4 atoms given in def_atoms.
The definitions have to be explicit here either by using atom indices or atom masks of the format moleculeID:residuetype_residueID:atom_name.
The next command is analyse_archive, which actually does the hard work reading the trajectory and measuring everything that was defined before. In the above case only a subset of the frames are processed as defined by the frames option. Three values are given here defining (first frame, last frame, interval).
The last command save_waves outputs the data to a tab-separated text file (results.tsv) , that can be read by most plotting programs in order to generate scatter plots of the data. The option log_statistic='true' will print some statistics of the wave to the CAT_log.xml file.